Prescriber-ETL-data-pipeline showing End-to-End implementation using Apache Airflow, pyspark and Apache superset to build BI dashboards
Project Overview
The dataset for this project contains the information about US Medical prescribers, their cities, years of experience, the cost for each prescribed medicine etc. The data that houses these information came in two format having a relation.The city dimensions table in parquet format and the fact table that comes in csv format containing the prescribers’ information. The goal is to load these data using the spec format into spark and utilizing spark rdd to process and transform by extracting insight off this large dataset about 4GB in size.
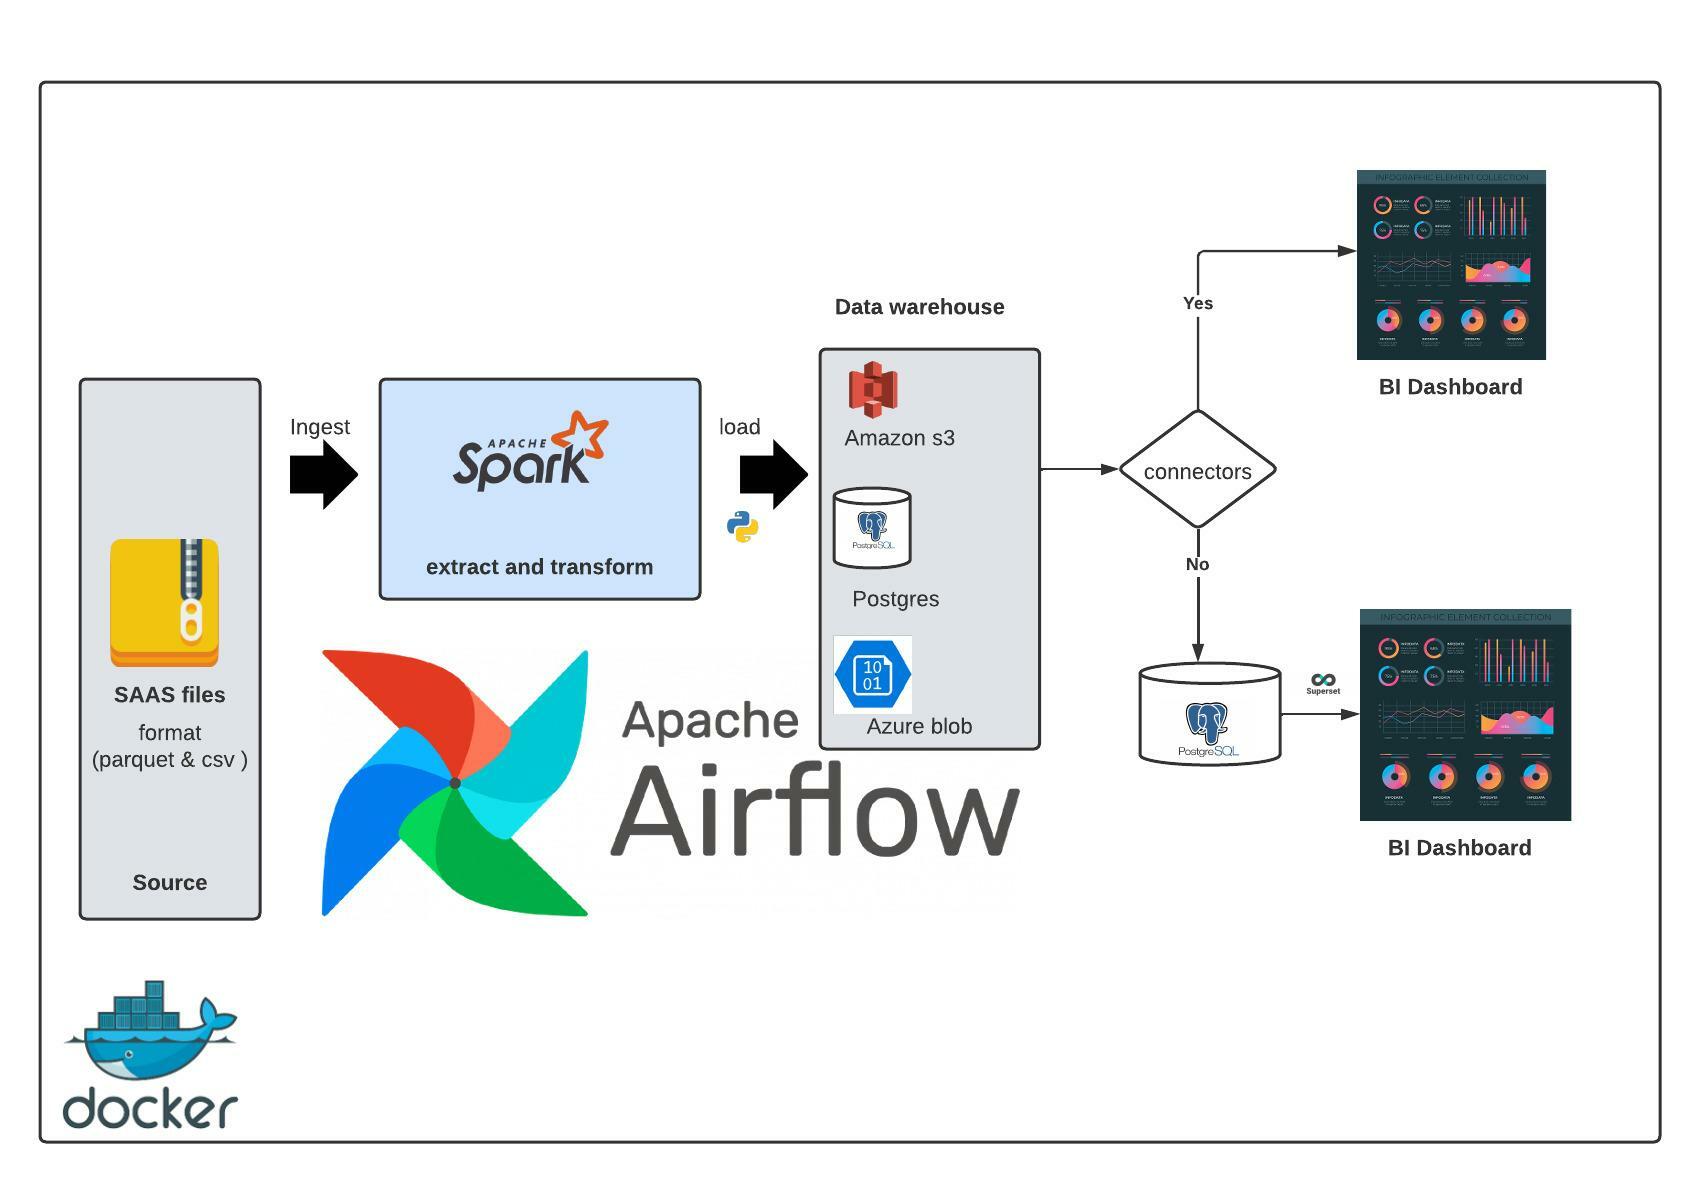
Architecture - Prescriber pipeline
Technologies and Functions
Pyspark: Data preprocessing, cleaning & transformationPython: data extraction & loadingAmazon s3: cloud storage as DWHAzure blob: Cloud storage as DWHPostgres: DWH on premiseDocker: ContainerizationApache Airflow: Orchestration tool and for running Cron jobsApache Superset: BI dashboard
Project structure
    ├── airflow_data
    │   └── airflow.cfg
    ├── dags
    │   ├── credentials
    │   │   └── variables.json
    │   ├── presc_pipeline.py
    │   └── __pycache__
    │       └── presc_pipeline.cpython-37.pyc
    ├── data
    │   ├── USA_Presc_Medicare_Data_2021.csv
    │   └── us_cities_dimension.parquet
    ├── docker-compose.yaml
    ├── Dockerfile
    ├── images
    │   ├── city-report-dashboard-2022-12-05T04-26-37.676Z.jpg
    │   ├── db1.png
    │   ├── db2.png
    │   ├── db3.png
    │   ├── pipeline_status.png
    │   ├── prescriber-dashboard-2022-12-04T21-49-29.517Z.jpg
    │   └── spark-architecture.jpeg
    ├── logs
    │   └── dag_processor_manager
    │       └── dag_processor_manager.log
    ├── plugins
    ├── requirements.txt
    ├── scripts
    │   ├── __init__.py
    │   ├── __pycache__
    │   │   └── validate.cpython-37.pyc
    │   ├── spark_etl.py
    │   └── validate.py
    ├── staging
    └── superset
        ├── city_report_dashboard.gif
        └── prescriber_report_dashboard.gif
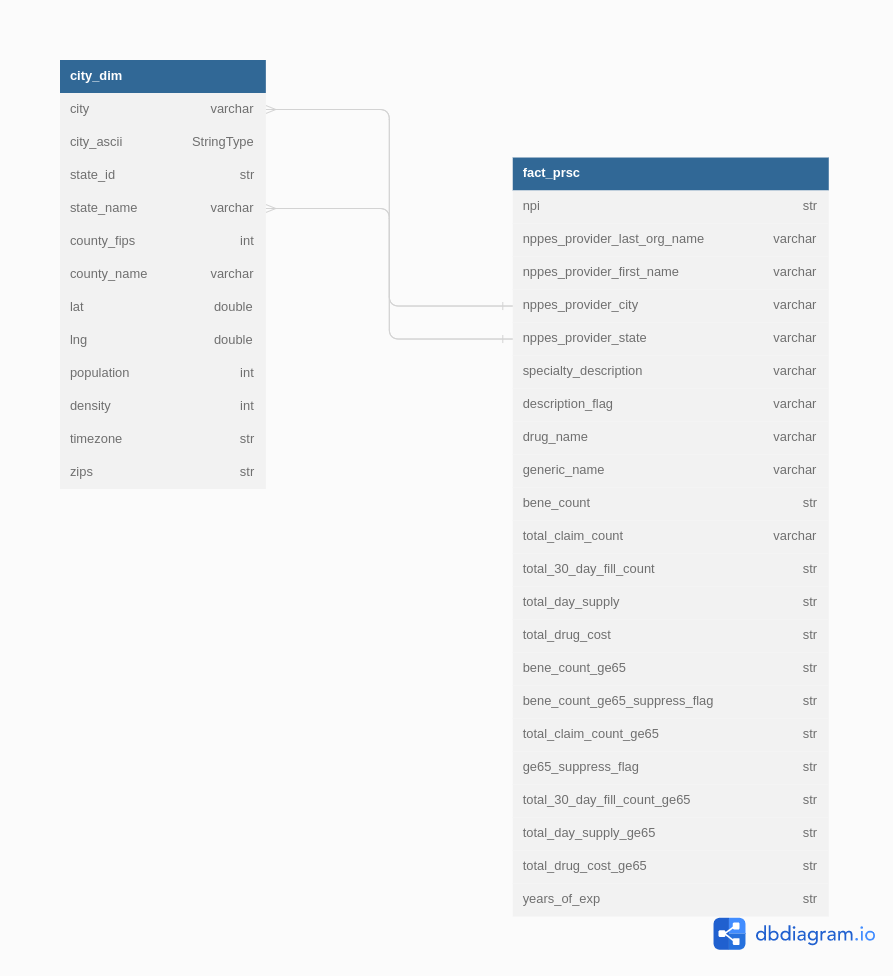
ERD
This is my proposed data model prior to data cleaning and transformation to help understand the structure of the data. Also note that some of the fields are not in the right datatypes the ERD is to help figure out how to map and cast each fields to suit our requirement purposes.
Spark ETL components/job
-
City transformation / report:- filter records by exempting cities which do not have any subscriber assigned
- calculate the number of zips in each city
- calculate the total transaction in each city
- calculate the number distinct prescribers assigned to each city
-
Prescriber transformation/ report:- apply filter to consider prescribers only from 20 - 50 years of experience
- rank the prescribers based on their transaction count for each state
- Select top 5 prescribers from each state
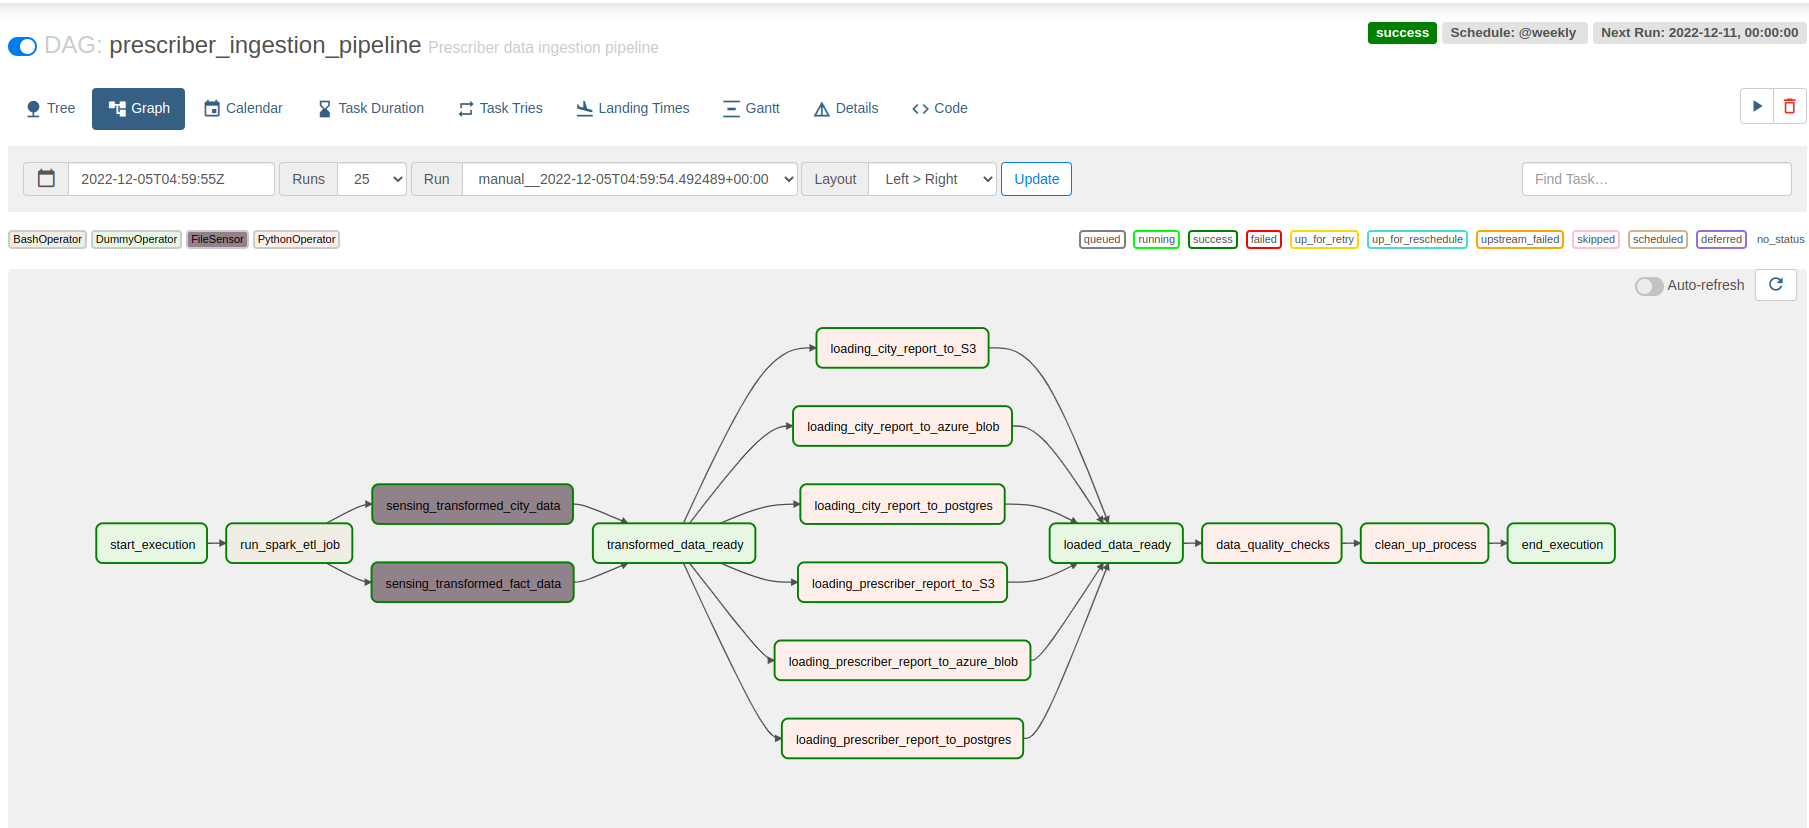
Pipeline runtime status -> executed successfully
pipeline is scheduled to run on weekly basis
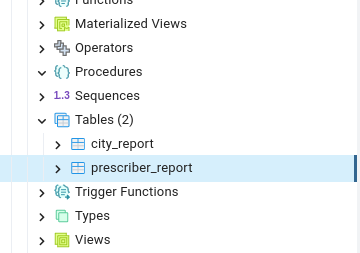
Tables in postgres
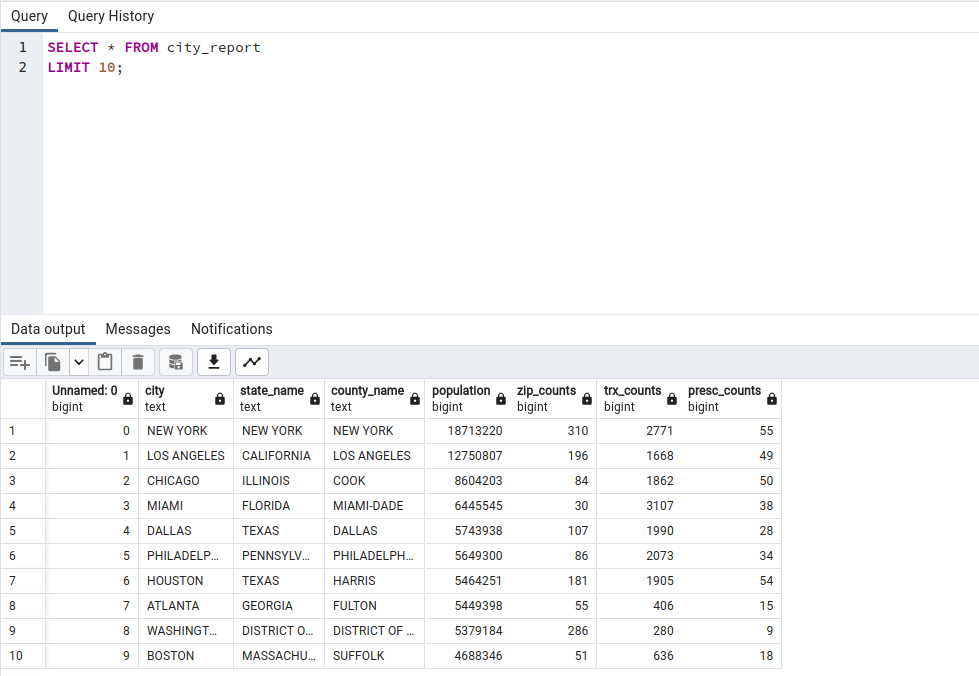
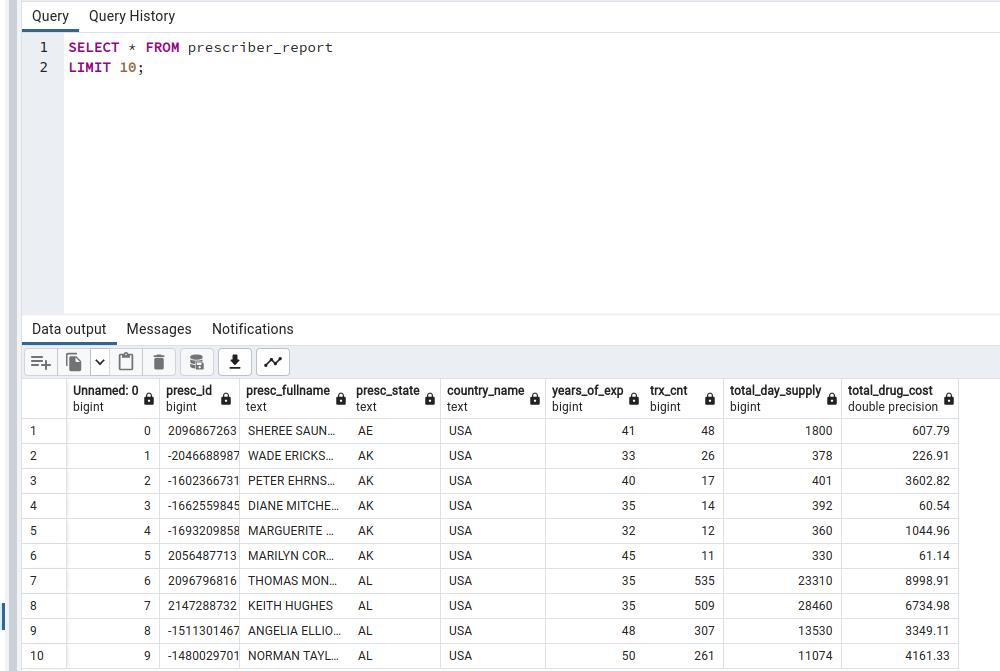
Querying report tables
city_report
prescriber_report
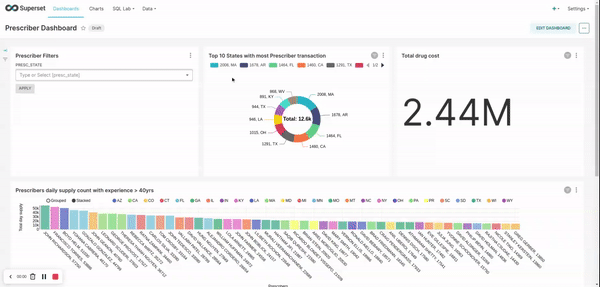
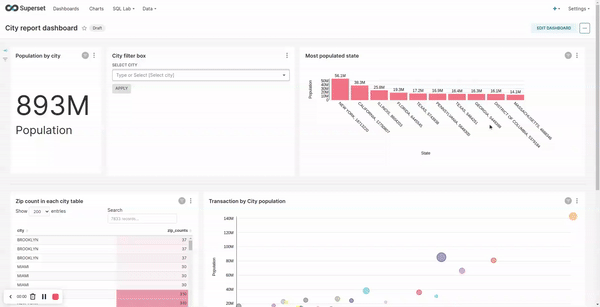
Visualizing city report dashboard in Apache superset
Visualizing prescribers report in Apache superset